Collision Diagram Module (Item# A-02)
Or Collision Diagram
Non-GIS Module (Item# B-01)
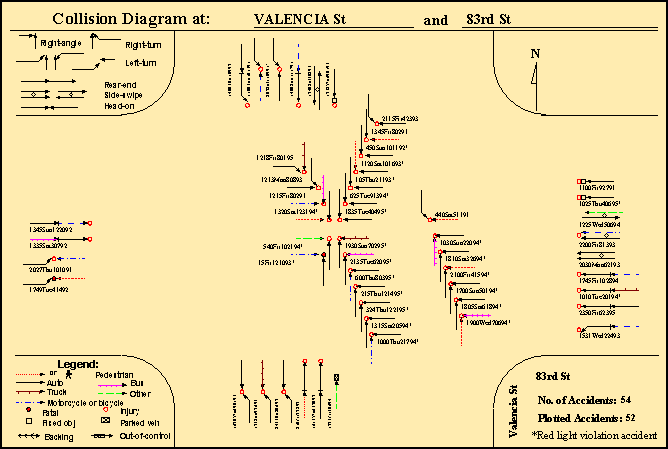
Figure A-02: Collision Diagram
Features:
·
It plots collision diagram according to your data and coding
definitions.
·
You can specify location to be plotted by clicking on the
map, by picking from a list of street names and intersections, or by entering
the street names.
·
You can label each collision with any or all of the
following: date, time, day of week, weather, pavement condition, accident
identification number, vehicle travel directions and collision type. The label
is in English description, because it converts the codes for weather, pavement
condition, vehicle travel directions and collision types into English.
·
It has a drawing/editing tool for adding texts, symbols,
lines, circles, rectangles, polygons, etc.
·
You can query any field in the data and plot only those
collisions according to the query.
·
It produces many reports, including:
§
A list of all records of the selected location.
§
A list of records from which collision diagram cannot be
plotted (good for checking coding error).
§
A yearly report, including number of accidents, injuries,
fatalities and pedestrian accidents.
§
A report by collision type, with collision type codes
converted into English.
§
A report by causes of collision, with collision cause codes
converted into English.
§
A report by day of week
·
It
saves the diagram and reports as files in various formats to be used by other
software.
·
It prints the diagram and reports in printer or plotter.
·
If you order the Accident Report Image Module (Item A-11),
when you click a plotted symbol, it will display the scanned accident report
image on the screen (see Figure A-11A).
Collision Diagram Non-GIS Module
(Item# B-01):
It has all features as
listed above, except that you cannot select locations from map. You can order
this module as separate software without the Main Module.
Additional Features To Facilitate Accuracy,
Starting June, 2007:
·
After plotting the collision diagram, you can click a button
to get a summary report about the collision type, travel direction of each
vehicle, turning movement of each vehicle, along with date and accident ID for
each accident.
·
If any information is missing or wrong in this summary
report, you can make corrections directly on the screen.
·
After you have made the corrections, just click another
button, AIMS will re-plot the collision diagram according to the corrections.
·
You can click another button and supply proper passwords to
save the corrections permanently (or you can print the corrected summary and
ask your maintenance person to make the corrections). Otherwise the corrections
are only reflected in the current session (that is, if you exit the current
session, the accident records remain unchanged).
·
You can click a button to re-label each plotted collision.
For example, you can label each collision with date, time, day of week,
weather, pavement condition, collision type, each vehicle's travel direction
and accident ID for checking purpose, then re-label them with date, time and
weather only for production purpose.
·
As a result, you can easily verify if AIMS has plotted the
collisions correctly, and you can easily correct your data.
| Home AIMS AIMS-Internet About Us Contact |
| Copyright © 2023, JMW Engineering, Inc. All rights reserved. Protected by U.S. Patent 6104410 |