AIMS-Internet
(Accident Information Management System-Internet Version)
I. Features
A. Plot collision diagrams on Google Earth
and Google Maps
B. Plot crash locations on Google Earth and
Google Maps
C. Help you visualize How Many, What & Where
D. Sample outputs
II. Computer requirements
III. Price
IV. How It Works
A. How we setup the software for you
B. How to plot results yourself
I. Features
A. Plot collision diagrams on Google Earth® & Google Maps®
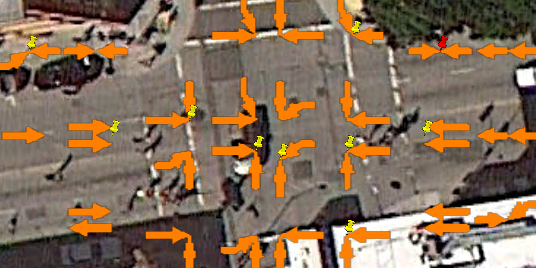
Figure A1: A typical collision diagram on Google Earth
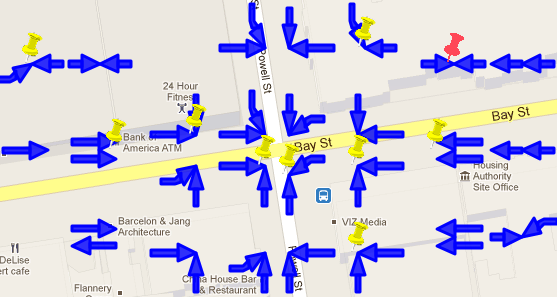
Figure A2: A typical collision diagram on Google Maps
1. It plots collision diagrams according to your data and coding definitions.
2. You can plot collision diagrams for up to a hundred locations
(intersections, mid-blocks, and corridors) on Google Earth & Google
Maps.
3. You can plot up to 500 crashes at a location.
4. When you click a plotted symbol, it displays the contents of the crash
record (associated with the collision) on the screen. You can filter out
any or all of the contents for privacy concern.
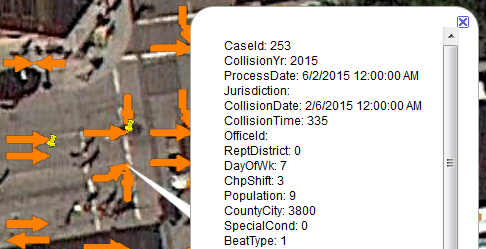
Figure A3: Displaying contents of a crash record
5. You can label each collision with up to 9 columns or fields from your
data. That is, you can choose none or up to 9 columns or fields as the
label for each plotted collision.
6. You can link to the scanned images of the police reports, such that when
you click a plotted symbol, you can display the scanned image on the screen. Therefore
you can
easily check the input data and the plotted collision against the original data.
7. You can assign color and size for the arrows when plotting the
collision diagram. For example, light color may stand out better against dark satellite image background on Google Earth/Google maps; bigger size
arrows may be more visible from higher altitude on Google Earth/Google
Maps; smaller size arrows may be able to fit more crashes into one
location without overlapping with adjacent locations; etc. Note that even
if the plotted collisions are very small and not visible from high
altitude, they will be visible when you zoom-in.
8. If you plot collision diagrams on Google Earth, you can save the output
as a KMZ file.
If you plot collision diagrams on Google Maps, you can save the output
as a HTML file. You can put this KMZ or HTML file in the Internet so
that anybody can access it and display it, including a person with tablet or smart
phone.
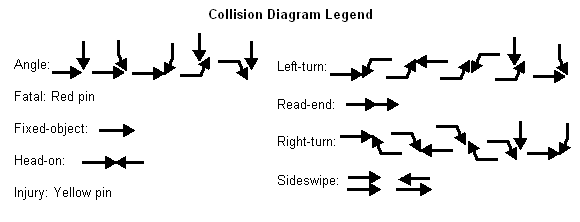
9. A collision diagram consists of one or two arrows, representing the
first two vehicles/pedestrians from your data. The arrowhead's
direction and turn represent the vehicle's travel direction and turning
movement. The legend below shows how the two arrows are plotted for
various collision types. A yellow or red pin denotes injury or fatality.
go to top
B. Plot crash locations on Google Earth® &
Google Maps®
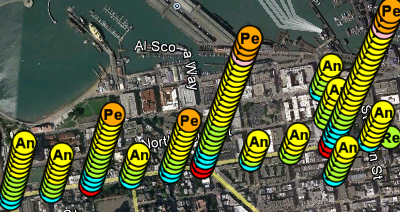
Figure B1: A typical crash location plot on Google Earth, using
different symbols
to represent collision types (An=angle, Ho=head-on, Re=rear-end, etc.)
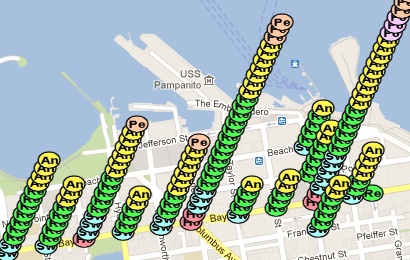
Figure B2: A typical crash location plot on Google Maps, using different symbols
to represent collision types (An=angle, Ho=head-on, Re=rear-end, etc.)
1. It uses patented* StackSymbol® to plot crash locations. Each crash
is plotted with a symbol. If a location has two or more crashes, it
stacks the symbols up, creating a 3-dimensional view. The number of
symbols at a location is proportional to the number of crashes at that
location. A location with the highest stack of symbols has the most
crashes.
2. You can plot up to a hundred crash locations
(intersections, mid-blocks, and corridors) on Google Earth and Google
Maps. That is, you can plot up to a hundred stacks of symbols.
3. You can plot up to 500 crashes at a location. That is, a stack may
have up to 500 symbols.
4. When you click a plotted symbol, it displays the contents of the crash
record (associated with the symbol) on the screen. You can filter out
any or all of the contents for privacy concern.
5. You can link to the scanned images of the police reports, such that when
you click a plotted symbol, you can display the scanned image on the screen. Therefore
you can
easily check the input data and the plotted symbol against the original data.
6. You can label each symbol with up to 9 columns or fields from your
data. That is, you can choose none or up to 9 columns or fields as the
label for each plotted symbol.
7. You can choose any column (or field) from your data to be plotted with
symbols.
8. You can assign different symbols (color, size and shape) to denote
different values of the chosen column (or field).
9. You can create your own symbols to be used for denoting different
values in your data.
10. You can assign a stack angle (0 to 360 degrees) to control how the
symbols within a stack are stacking up on top of one another. For example,
a stack angle of 60 degrees means the symbols within a stack will be
stacking up at 60 degrees relative to a horizontal line, starting from
right.
11. If you plot crash locations on Google Earth, you can save the output
as a KMZ file.
If you plot crash location on Google Maps, you can save the output
as a HTML file. You can put this KMZ or HTML file in the Internet so
that anybody can access it and display it, including a person with tablet or smart
phone.
*Us Patent#6104410.
go to top
C. Help you visualize How Many, What & Where
Crash locations plotted with StackSymbols®, as described above, helps
you visualize "how many", "what" and "where" about your data:
1. For example, if your data have a collision-type-column, you can choose
this collision-type-column to be plotted with symbols; and you can assign
symbol "An" to denote angle collisions, symbol "Re" to denote rear-end
collisions, symbol "Sw" to denote sideswipe collisions; etc. After you have plotted the data, if a location has a
stack containing 5 "An" symbols, 3 "Re" symbols and 1 "Sw"
symbol, such as the location at Polk St (the left stack of symbols)
in Figure C1 below, it means that that
location has a total of 9 crashes, 5 of the crashes are angle collisions,
3 of the crashes are rear-end collisions, and one of the crashes is
sideswipe collision.
Hence the plot helps you visualize how many, what and where about your
data.
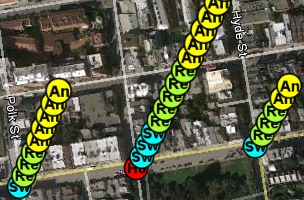
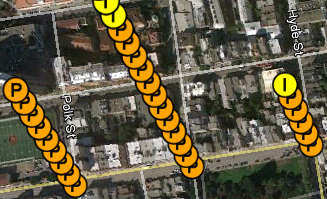
Figure C1: Plotting data with collision-type-column
Figure C2: Plotting data with severity-column
2. If your data have a severity-column, you can re-plot the same data in
1, but this time, choose severity-column to be plotted with symbols. You
can assign symbol "F" to denote fatal collisions, symbol "I' to denote
injury collisions, and symbol "P" to denote property-damage collisions. After
you have re-plotted the data, look at the same location as in 1, such as
the location at Polk St (the left stack of symbols) in Figure C2
above.
(The location should also have 9 crashes because plotting the same data.)
It shows that the location at Polk St has 9 "P" symbols, meaning all 9
crashes are property-damage collisions.
3. When plotting repeatedly with different columns for the same data, as
mentioned in 1 and 2, you can assign a different stack angle to
each plot (refer to Item B.10), then save each plot in a different KMZ file,
then display all the saved KMZ files on the same Google Earth, as shown in
Figure C3 below.
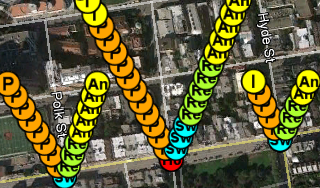
Figure C3: Displaying multiple output files together on the same Google
Earth
In Figure C3,
the plot with collision-type-collision (from Figure C1) uses a stack angle of 60 degrees,
while the plot with severity-column (from Figure C2) uses a stack angle of 120 degrees.
When both plots are displayed on the same Google Earth, they will not
be blocking each other, hence you can see the both collision type and severity
of each location at the same time. For example, at Polk St (i.e. the
left-most stacks), you can see
that there are 9 crashes, 5 of them are angle, 3 of them are rear-end, and
1 of them is sideswipe; and all 9 crashes are property-damages only.
4. You can repeat
1, 2 and 3 with any other column(s) from the same data, hence you
can visually see different aspect of "what" about the same data.
Furthermore, you can click a symbol to see the detail contents of a
record (refer to Item B.4) and its original scanned image report (refer to
Item B.5), hence the software helps you visualize over-all as well as
individual details about your data.
5. In addition, you can plot collision diagrams for the same data and save
the output as another KMZ file and add it to the same Google Earth, then
you can visualize the collision diagrams at the same time.
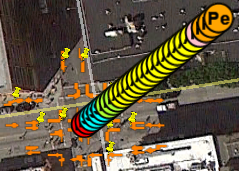
Figure C4: Displaying crash locations and collision diagrams together
go to top
D. Sample outputs
To display a sample outputs:
1. You must be connected to the Internet.
2. To be able to display in Google Earth, you have to installed it on your computer first.
(Free download:
http://earth.google.com
.)
3(a). Click a link below to display it.
(b). Choose 'Open', if the screen asks what to do.
| Link |
Display on |
Description |
| Collision diagram 1 |
Google Earth |
arrow size=small; arrow color=orange; clicking an arrow will display all columns of a crash record. |
|
Collision diagram 2
|
Google Earth |
arrow size=bigger; arrow color=blue; clicking an arrow will display
selected columns of a crash record.
|
|
Collision diagram 3
|
Google Maps |
arrow size=small; arrow color=orange; clicking an arrow will display
selected columns of a crash record.
|
|
Collision diagram 4
|
Google Maps |
arrow size=bigger; arrow color=blue; clicking an arrow will display
selected columns of a crash record.
|
|
Crash location 1
|
Google Earth |
symbol=collision type; stack angle=60°; clicking a symbol will display all columns of a crash record. |
|
Crash location 2
|
Google Earth |
symbol=severity; stack angle=120°; clicking
a symbol will display selected columns of a crash record.
|
|
Crash location 3
|
Google Maps |
symbol=collision type; stack angle=60°;
clicking a symbol will display all columns of a crash record.
|
4. The sample outputs are repeated plots from the same input data, using AIMS-Internet and setting different
parameters within the program. The input data are created for illustrations only.
5. Instructions for Google Maps:
♦ Click "Quick help" button on top-left side of the
plot, instructions will appear on the screen.
6. Instructions for Google Earth:
(a) For crash location:
♦ If you zoom-in more, symbols within a stack will be farther apart, and each symbol
will expose more.
(b) For all plots:
♦ Click a symbol or arrow to view the contents of a record.
♦ On left-side of Google Earth, under "Places" and "Collision Diagram" or "StackSymbol", is a list of locations.
Double-clicking a location
will zoom-in and go to that location.
♦ On the same list, check or uncheck the box next to a location will show or hide the
plotted symbols/arrows at that location. (You can hide other locations if they
are interfering.)
(c) How to display multiple output files on the same Google Earth:
♦ Save the output files (kmz files) on your computer.
♦ Double click one of the kmz files to display it.
♦ In Google Earth, click "File" and "Open" to open another (and another) kmz file.
♦ Each kmz file will be listed under "Places". If it is collision diagram, it will be listed with a globe and "Collision Diagram".
If it is crash location, it will be listed with a globe and "StackSymbol". It will then followed by a list of locations.
♦ You can hide a plot by unchecking the box next to the globe. You can hide a location
within a plot by unchecking the box
next to the location within the plot. This is useful if the symbols are overlapping with or blocking another location.
go to top
II. Computer Requirements
A. Software
1. Windows® 10 or 11.
2. Google Earth® 6.x or later to be installed in your computer, if you want
to display outputs in Google Earth. (Free download from
http://earth.google.com
.)
Note: Licenses for above software are not included in AIMS-Internet.
B. Hardware
Any Intel Core or equivalent CPU; 2 GB or more of RAM; 100 GB or more of free hard disk space;
1024x768 or higher color screen.
go to top
III. Price
Please contact us.
go to top
IV. How It Works
A. How we setup the software for you
1. We setup the software to use your data and coding definitions, so that
you do not need to change your data and coding definitions. It is similar to
hiring us as a contractor to develop the software particular for you. However,
we can do everything for you through the Internet, email and telephone. Hence it
will cost much less to you.
2. Upon receiving your order, we will ask you to provide:
(a) Sample crash data
Provide 100 to 1,000 crash records. Save the data in a file in one of the following formats:
♦ Excel (XLS)
♦ Access (MDB)
♦ Comma-separated values (CSV)
♦ dBase (DBF)
♦ Text (TXT) with comma as delimiter
♦ XML
(Note: If sample data have private information, replace them with dummy information. Replace
them first before sending to us, but keep the data structure (i.e. column names,
column types and column lengths) unchanged. For example, replace all birthdates with one dummy date, all personal names with one dummy
name, etc., while leaving all other parts of the data unchanged.)
(b) Which column(s) contain location information. Location information
include any or all of the following: address, mile point, route, road, street,
intersection, distance, direction, city, county, state, province, zip, country,
etc.
(c) Which column(s) contain collision type. What are the coding definitions.
(d) Which column(s) contain travel direction. What are the coding definitions.
(e) Which column(s) contain turning movement. What are the coding definitions.
(f) Which column(s) contain severity (fatal, injury, etc.). What are the coding definitions.
3. When we have received the above items, we will start setting up the software to use your data and coding definitions.
We will also program the software to automatically convert the location
information from your data into the corresponding locations on Google Earth and
Google Maps.
4. Such setup enables you to simply click a button to input your data
and then click another button to plot the result. It may take 2 weeks to 6
months.
5. When we have finished setting up, we will deliver the software to you.
6. You will be able to install the software yourself.
B. How to plot results yourself
1. Save the data to be plotted in a file in any of the following formats:
♦ Excel (XLS)
♦ Access (MDB)
♦ Comma-separated values (CSV)
♦ dBase (DBF)
♦ Text (TXT) with comma as delimiter
♦ XML
2. Click a button in the software to read the data.
3. Click a button to choose whether to plot collision diagrams or crash locations.
4. Click a button to choose whether to plot on Google Earth or Google Maps.
5. That is it. If you know how to click the above 3 buttons, you can plot results yourself. (The reason you can do this is because
we have programmed the software to use your data and coding definitions in "A. How we setup the software for you".
6. Optionally, if you need to re-plot or refine the output (changing colors, sizes and types of symbols/arrows; deciding which columns
of the data to be displayed when clicking a plotted symbol/arrow; etc.) there will be on-screen instructions to guide you.
7. Optionally, you can filter data from your input file, such as only plot records within certain dates, times, locations, collision types, etc.
Or, you can perform query on any columns of your data and only plot those records that satisfy your query.
There will be on-screen instructions to guide you how to do it.
Note: The software always make a copy of your input file and work on the copy only, leaving your original input file unchanged.