Collision Diagrams On GIS Map Module (Item#
A-12)
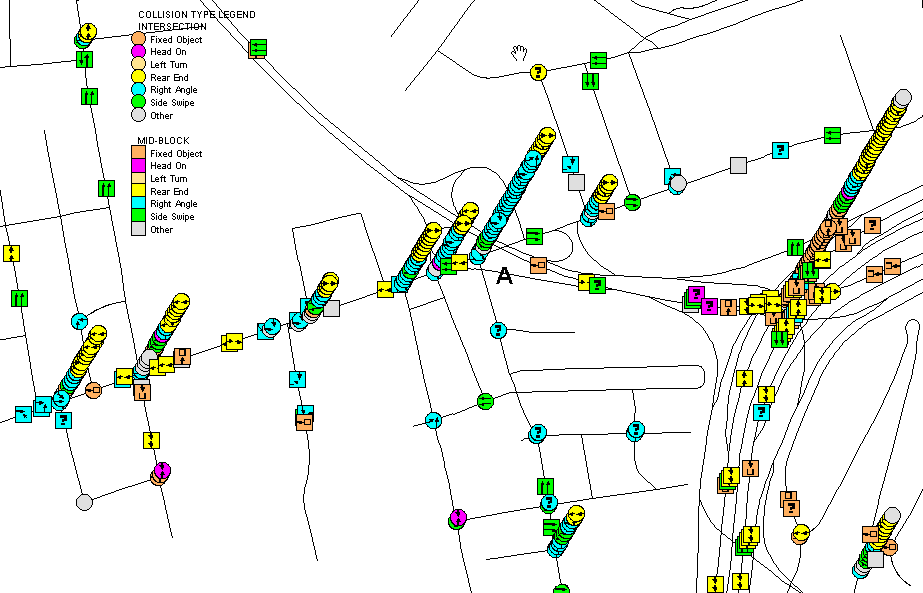
Figure
12A: Plotting Collision diagrams On GIS Map In 3
Dimensions
Features:
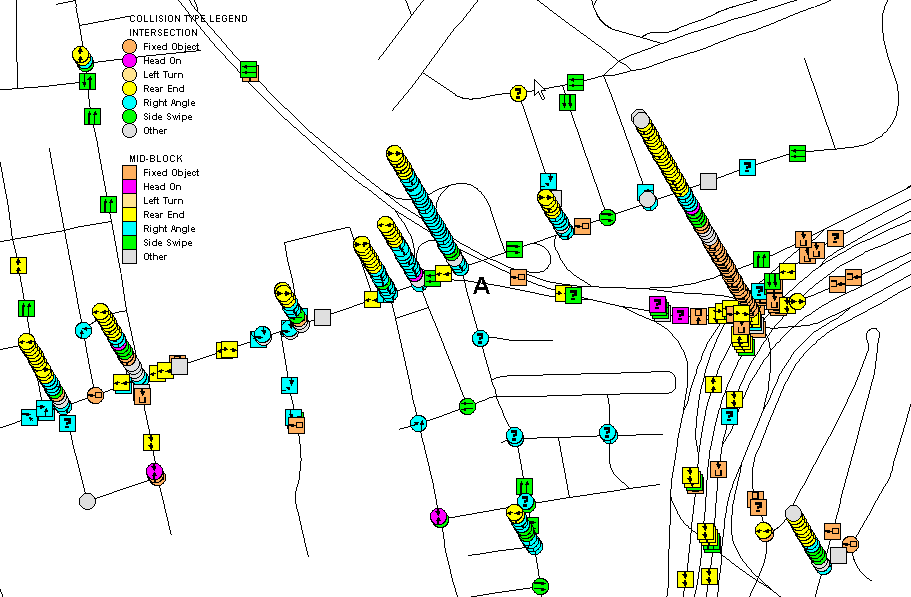
It
plots collision diagrams directly on a GIS map. Each symbol denotes a
crash. Circles denote intersection crashes. Squares denote mid-block
crashes. Colors denote collision types. Inside each symbol, there are 2
arrows, representing the travel directions and turning movements of 2
involved vehicles and/or pedestrians. If one of the involved vehicles was
going north, for instance, then one of the arrows inside the symbol will be
pointing north (a "?" represents missing data). If the crashes are at
the same location, the symbols will be stacked on top of one another,
creating a 3 dimensional view. Because of 3-D viewing, you can visualize
high accident locations from the symbols' heights, as well as the dominant
collision types from the symbols' colors. You can zoom-in to see the arrows
inside each plotted symbol; hence you can determine the collision type,
travel directions and turning movements of each collision. It is useful for
both regional and localized traffic safety analyses.
· You
can plot collision diagrams for one location, or for hundreds or
thousands of locations.
· To
plot them, you can select locations from the map by drawing one or more
areas of any shapes; or you can select locations by querying any fields
in your data.
·
After selecting the locations, you can click
a button to plot them out. Figure 12A is a typical output.
·
You can: (It
has the 3 dimension plotting features of the AIMS Main Module.)
- Modify the plot with any combinations of size, color, angle,
and height factor of symbols to produce almost unlimited number
of plots (Figures 12B to 12D).
- Label each symbol with information from 1 to 10 fields in your data (Figure 12E).
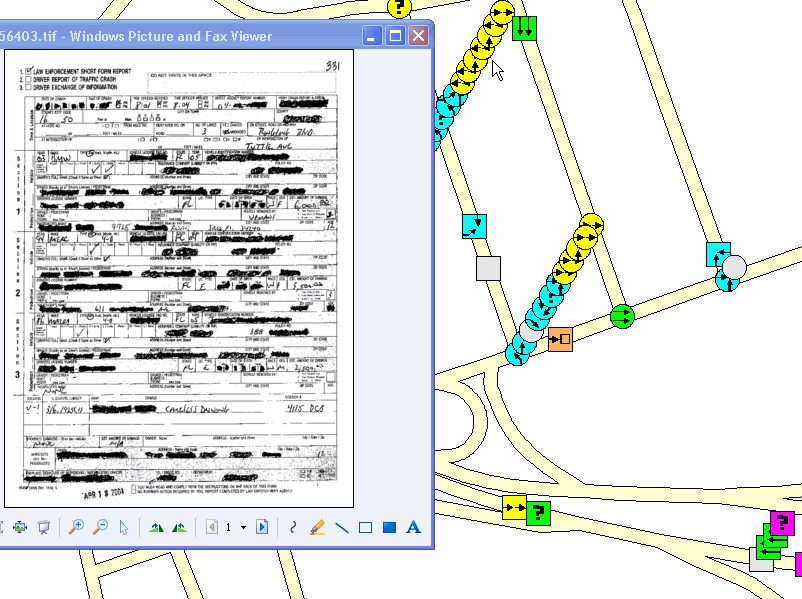
- Click a symbol to display the scanned accident report image
(Figure 12F).
- Plot the collision diagrams on roadway layout (Figure 12G).
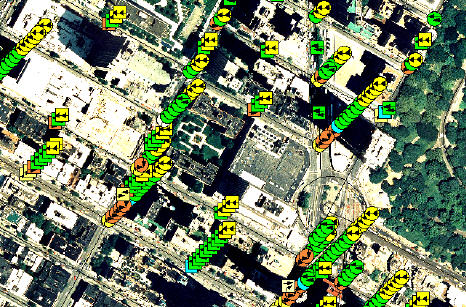
- Plot the collision diagrams on aerial photograph (Figure 12H).
Figure
12B: Same As Figure 12A, Except Plotting With A Different Symbol Stack Angle
(You can modify any plot with a symbol stack angle of 0 to 360
degrees. Figure 12A uses 120 degrees. Figure 12B uses 60 degrees. 0
degree is horizontal to the right. 90 degree is vertically up. Plotting
in different angles will avoid some locations being blocked.)
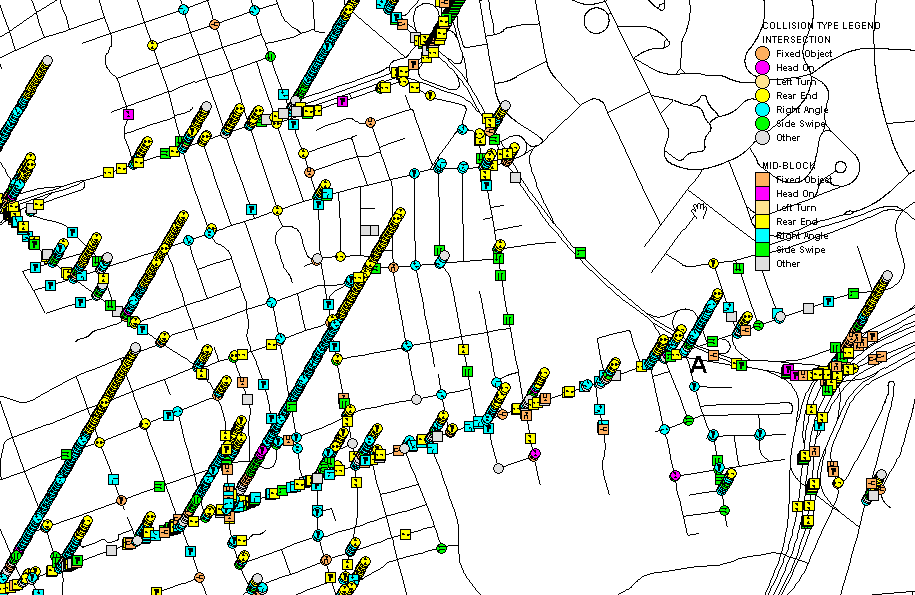
Figure 12C: Zoom-Out View of Figure
12A, Plotting With Smaller Symbol Size And Height Factor
(By
zooming-out and plotting with a smaller symbol size and height factor, you
can view the whole study area. You
can visualize the high accident locations from the height of
stacked symbols. You can visualize the dominant collision types from
the symbol colors. It is useful for area-wide analysis.)
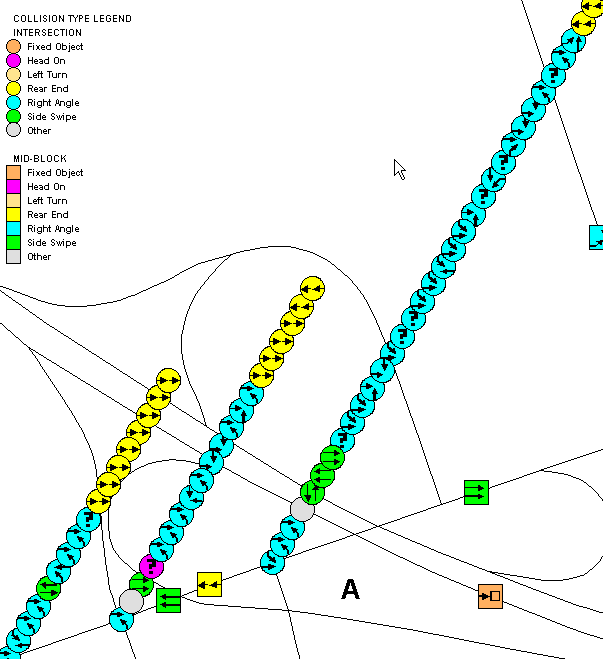
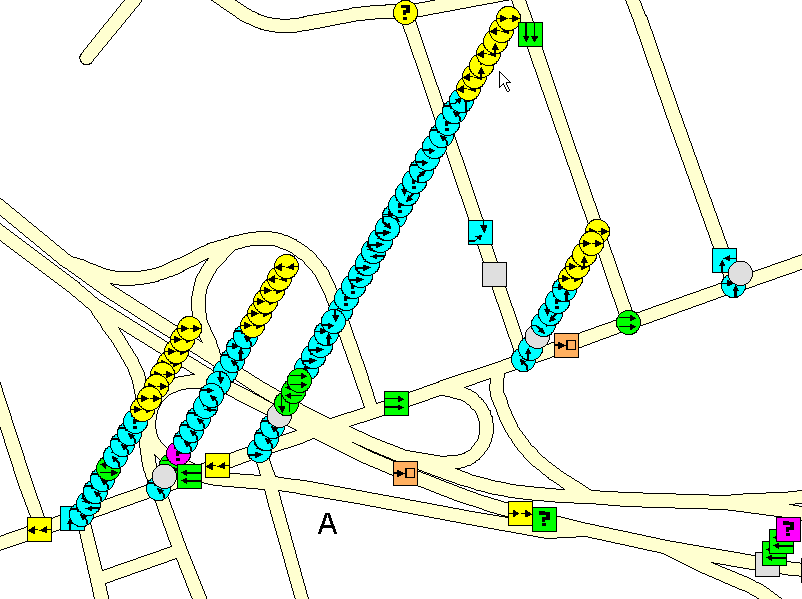
Figure 12D: Zoom-In View of Figure 12A, Plotting With Bigger Symbol Size and
Height Factor
(By
zooming-in and plotting with bigger symbol size and height factor, you
can see the arrows inside symbol clearly. Hence you know the collision type, travel directions and turning movements of
each crash at each location. It is useful for analyzing individual locations,
such as the interchange area around location A.)
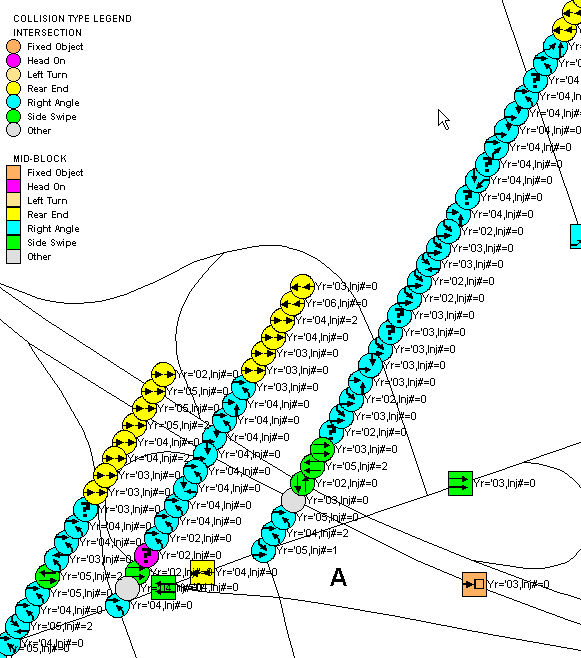
Figure 12E: Labeling Each Symbol With Year and Number of Injuries
(You can label each symbol with information from 1 to 10 fields in your data. You can choose size, color and style of font.
You can create expressions to make the label meaningful. For example,
when labeling year and number of injuries, the expression <"Yr="
+ YearField + ",Inj#=" + InjuryField> will insert the word
"Yr=" before each year information, and so on as shown above.
Note: You can modify the plot with different angle, height and size of symbols
if some labels are blocked.)