Google Earth Inferface Module (Item# A-18)
Features:
·
AIMS can interface with Google Inc.’s Google Earth. Since
Google Earth includes aerial photograph, it facilitates relating accident
occurrence to the surrounding environment.
·
When you click a button in AIMS, AIMS will execute Google
Earth and will display the 3-dimensional plot or collision diagram on Google
Earth’s aerial photograph.
·
Once it is displayed inside Google Earth, it becomes Google
Earth’s layer. You can use Google Earth’s capabilities for further processing
and manipulation, such as clicking a symbol to display its descriptions,
zooming-in and -out, modifying, saving, emailing, adding placemark, adding
path, etc.
·
If you have the AIMS Main Module, AIMS will display the
intersection and mid-block accidents in 3 dimensions in Google Earth as shown
in Figures A-18A and A-18B.
·
If you have the AIMS Collision Diagram Roadway Layout
Module, AIMS will display the collision diagram in Google Earth as shown in
Figures A-18C and A-18D.
·
When you click on a plotted symbol, it will display the
location, date, day of the week, time, collision type, severity, etc. of the
accident associated with the symbol.
·
You can display hundreds of accident locations in Google
Earth similar to Figures A-18A and A-18B.
·
You can display collision diagrams for up to a hundred
locations (intersections, mid-blocks and corridors) in Google Earth similar to
Figures A-18C and A-18D.
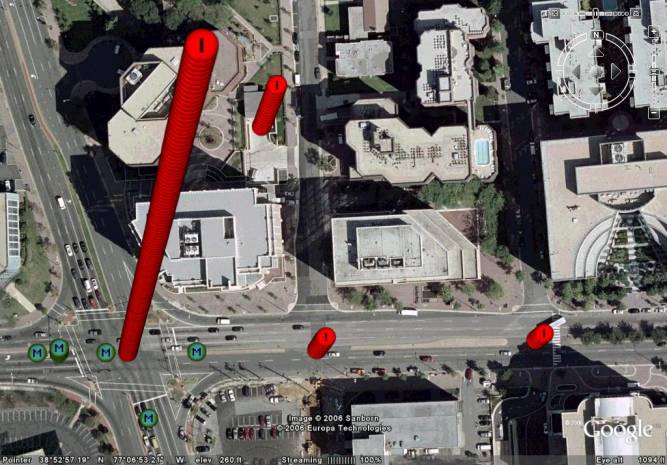
Figure A-18A: Google Earth Interface Sample Output – Displaying intersection and mid-block accidents, where “I” or red symbols = intersection accidents, “M” or blue symbols = mid-block accidents; accidents occurred at the same location are stacked on top of one another, creating a 3-dimensional view.
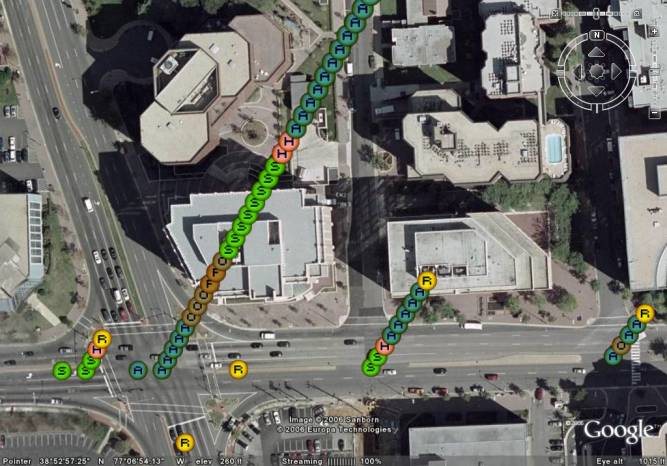
Figure
A-18B: Google Earth Interface Sample Output – Displaying accident types, where
“A” = angle, “F” = fixed-object, “H” = head-on, “L” = left-turn, “O” = other,
“R” = rear-end, “S” = side-swipe, etc. ; accidents occurred at the same
location are stacked on top of one another, creating a 3-dimensional view.
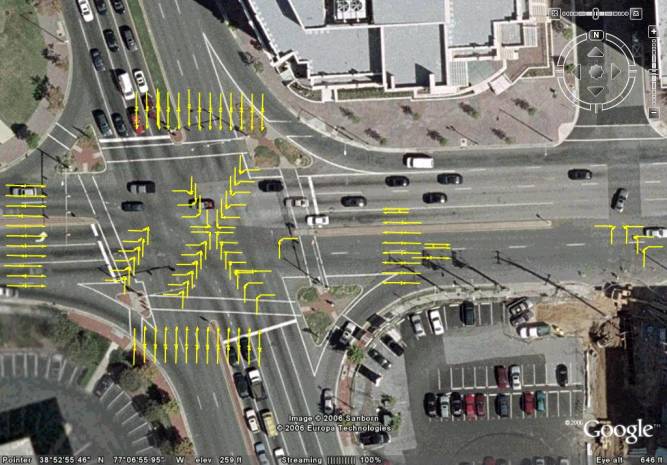
Figure A-18C: Google Earth Interface Sample Output –
Displaying collision diagrams for one or more intersections and mid-blocks at
the same time.
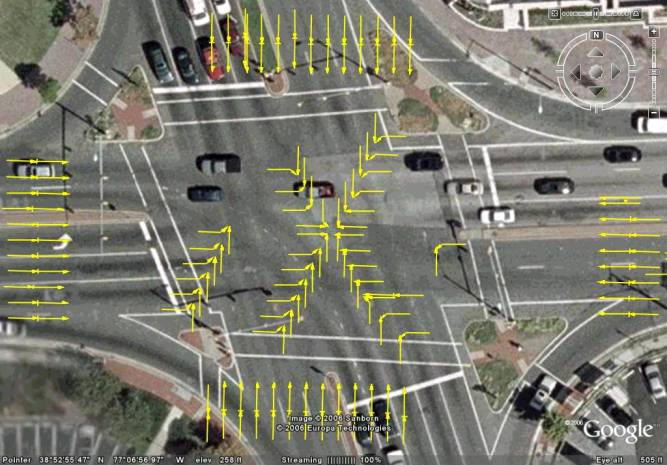
Figure A-18D: Google Earth Interface Sample Output – Same as Figure A-18C, but zoom-in more to an intersection.
| Home AIMS AIMS-Internet About Us Contact |
| Copyright © 2023, JMW Engineering, Inc. All rights reserved. Protected by U.S. Patent 6104410 |