(Accident Information Management System - Safety Analyst Version)
A. Development History
B. It Plots Collision Diagrams For Safety Analyst
C. It Displays Crash Locations On Map In 3-Dimensional
Symbols
D. It Displays Collision Diagrams & Crash Locations On
Map
E. It Displays Results In Google Earth and Google Maps
F. Computer Requirements
G. Price
H. Demo Video
AIMS-Safety Analyst is a software that interfaces with AASHTOWare Safety
AnalystTM.
(It is called SafetyAnalyst before 2013.) It
plots collision diagrams and crash locations on a map. It displays
output in Google Earth and Google Maps. The sections below provide detail information. This video, in YouTube, shows how it works.
A. Development History of AIMS-Safety
AnalystTM:
back to top
B. It Plots Collision Diagrams For Safety AnalystTM:
1. When you click the Collision Diagram button in Safety Analyst's Edit Site List screen, AIMS-Safety Analyst will create collision diagrams for the selected site.
2. You may display the collision diagrams on conventional blank surface (see Figure B-1), or display them on a map with satellite image (see Figure B-2).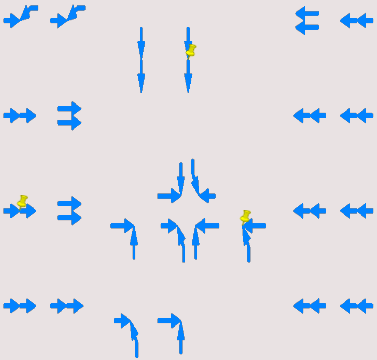
Figure B-1:Collision diagrams on blank surface
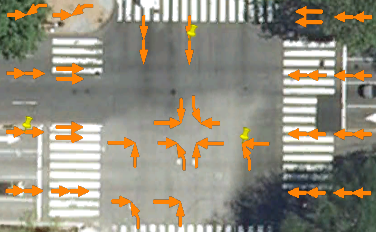
Figure B-2: Collision diagrams on a map with satellite image
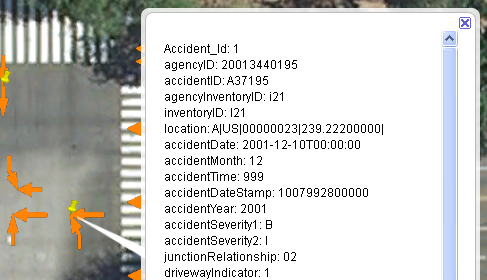
Figure B-3: Displaying contents of original data record from Safety Analyst when clicking a plotted symbol
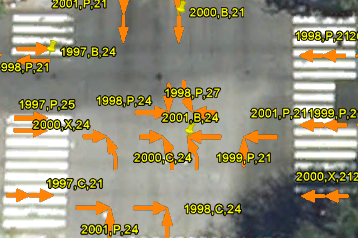
Figure B-4: Labeling each collision with year, severity and collision type
5. If you combine sites in Safety Analyst, then click the Collision Diagram button, AIMS-Safety Analyst will create collision diagrams for each of the combined sites. It creates collision diagrams for up to 100 locations, and up to a thousand crashes per location.
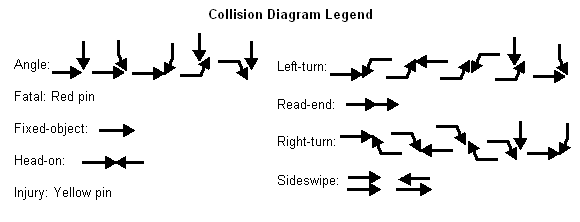
6. The figure below shows the collision diagram legend.
C. It Displays Crash Locations On Map In
3-Dimensional Symbols:
1. It display crash locations on map for Safety Analyst. You have the choice of displaying crash locations from Safety Analyst's accident file, or from Safety Analyst's site list file.
2. When displaying crash locations, if a location has two or more crashes, it stacks the symbols up at that location, creating a 3-dimensional view. The number of plotted symbol within a stack is proportional to the number of crashes at a location. The location has the highest stack of symbols means that location has the most crashes. Hence you can easily visualize the high crash locations, as shown in Figures C-1 to C-4.
3. You may choose any field from data to be plotted with symbols; and you may assign various shape/color/size of symbols to denote different values in the chosen field, as shown in Figures C-1 to C-3.
4. Figure C-1 shows that "collisionType" is the chosen field from
Safety Analyst's accident data to be plotted with symbols. If the value
in "collisionType" is 24 (means angle collision) , it will be plotted
with a yellow "An" symbol; if the value in "collisionType" is 22 (means
head-on collision), it will be plotted with a red "HO" symbol, and so
on.
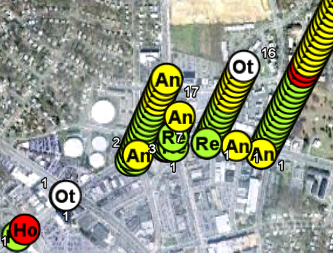
Figure C-1: 3-Dimensional stacked symbols showing collision type (An=angle, Ho=head-on, Re=rear-end, Sw=sideswipe. The number next to each stack denotes the total number of crashes at that location)
5. Figure C-2 is another example, showing "accidentSeverity1" is the
chosen field to be plotted with symbols. If the value in
"accidentSeverity1" is C (means minor injury), it will be plotted with a
yellow "C" symbol; if the value in "accidentSeverity1" is P (means
property damage only), it will be plotted with a blue "P" symbol, and so
on.
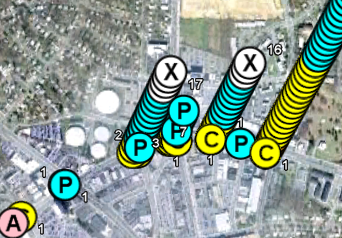
Figure C-2: 3-Dimensional stacked symbols showing accident severity (A=inj, incapacitate; B=inj, serous; C=inj, minor; K=fatal, P=property damage; X=unknown.
6. Figure C-3 is another example, showing "accidentYear" is the
chosen field to be plotted with symbols. If the value in "accidentYear"
is 1999, it will be plotted with a blue "99" symbol; if the value in
"accidentYear" is 2002, it will be plotted with a yellow "02" symbol,
and so on. (Year less than 2000 is blue.)
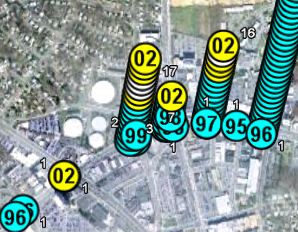
Figure C-3: 3-Dimensional stacked symbol plot showing accident year (95=1995, 02=2002, O=other, etc. The number next to each stack denotes the total number of crashes at that location))
7. Figures C-1 to C-3 are viewed from altitude of about 1.5 miles
above ground. At this altitude, you can see a wide area, but the symbols
within a stack may be packed together, so that you may not be able to
distinguish them. However, if you zoom-in nearer to ground (or if you
apply a distance/altitude factor of greater than 1), the symbols in a
stack will be farther apart, as shown in Figure C-4.
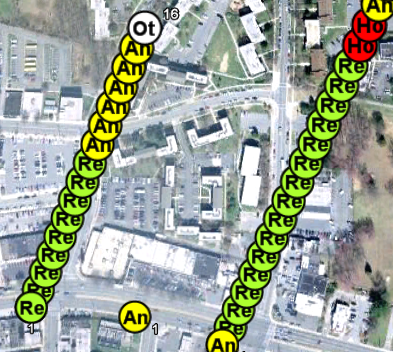
Figure C-4: Same as Figure C-1, but viewing from lower altitude to see each symbol.
8. Each plotted symbol is linked to a record in Safety Analyst's
accident data or site list data. When you click a plotted symbol, it will
display the contents of the records on the screen, as shown in Figure
C-5. User can filter out any or of all of the contents for privacy
concern.
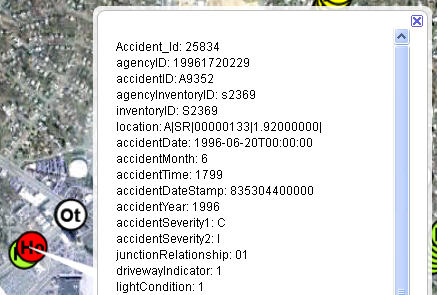
Figure C-5: Displaying contents of original data record from Safety Analyst when clicking a plotted symbol
9. User can assign a different stack angle for each plot. User can
also view multiple plots at the same time. For example, if we use a
stack angle of 60, 45 and 75 degrees respectively for the plots in
Figures C1, C2, and C3; and if we display the plots (outputs) in Google
Earth, the result would be as shown in Figure C-6. That is, you can
visually see the crashes in terms of collision type, severity and year
at the same time.
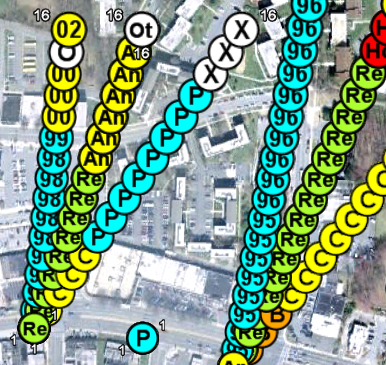
Figure C-6: Displaying 3 results at the same time, each stacking up in different angle.
10. The 3-dimensional stacked symbol display, as shown above, provides the following advantages:
11. The 3-dimensional stacked symbol display as described above is unique, because it is based on US Patent 6104410, Method and Apparatus For Displaying Stacked Symbols To Create A Multi-Dimensional View. Our company's staff member is the inventor and patent holder.
D. It Displays Collision Diagrams & Crash Locations On Map (Even If Data Have No Coordinates)
1. As mentioned in B, if you select a site
in Safety Analyst's Edit Site List screen, it will plot the collision
diagrams for the selected site. If your data include coordinates
(latitudes and longitudes), it will automatically plot the collision
diagrams in Google Earth or other web-based mapping system. If you data
do not include coordinates, you may click a button in
AIMS-Safety Analyst, then enter
the address/street names plus city and state of the site, it will
also plot the collision diagrams in Google Earth or other
web-based mapping system. In the following examples, we will use the
Safety Analyst's sample dataset to show how to plot collision diagrams
and 3-dimensional stacked symbols together.
2. Suppose you want to plot the collision diagrams for the Int/Urb 4-leg
signalized location (at Route=SR00000133, StartLocation=3.202,
County=69) from Safety Analyst's sample data, you simply select this site
in Safety Analyst's Edit SiteList screen, then click Collision Diagram
button. Suppose this site is actually at 14thSt and Constitution Ave NW
in Washington DC, when AIMS-Safety Analyst appears, enter the text "14thSt and
Constitution Ave NW Washington DC", then click Plot Collision Diagram
button, it will plot the collision diagrams in Google Earth, at the
specified location, as shown in Figure D-1 (assuming you have installed
Google Earth in your computer). This means that even if your data do not
have coordinates, if you know the address or street location,
AIMS-Safety Analyst will
plot the collision diagram at the right location for your.
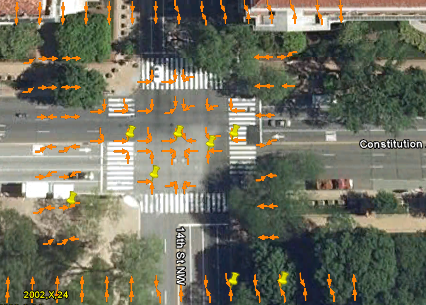
Figure D-1: Plotting collision diagram for a site in Safety Analyst's sample data as a real site in Washington DC
3. If you click the Plot StackSymbol button in AIMS-Safety Analyst, it will plot
the same data with 3-dimensional stacked symbols. If you save the
collision diagrams output (in step 2 above) and the 3-dimensional
stacked symbols output respectively, then open both outputs in Google
Earth, it will be as shown in Figure D-2.
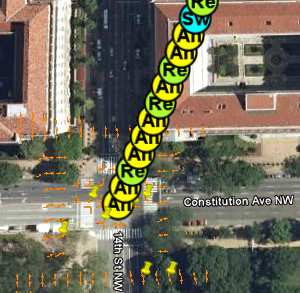
Figure D-2: Plotting 3-dimensional stacked symbols for the same data as Figure D-1.
4. You can evaluate many sites at the same time, by repeating steps 2 and 3 above.
Suppose you want to evaluate 4 additional sites on the same route from
the Safety Analyst's sample data (on Route=SR00000133,
with StartLocation=3.702, 5.214, 6.213 and 8.727 respectively). The
Safety Analyst's sample data do not have coordinates. However, suppose
these 4 locations are actually on Constitution Avenue at 15th, 16th,
17th and 18th Street in Washington DC respectively. We simply repeat
steps 2 and 3 above for each location, and save the outputs for each
location, and then open all outputs in Google Earth. The
result will be as shown in Figures D-3 and D-4. Figures D-3 and D-4 are
the same display except that Figure D-4 zooms in more to the right two
locations. Note that it only take a few minutes to create a display as
show in Figures D-3 and D-4.
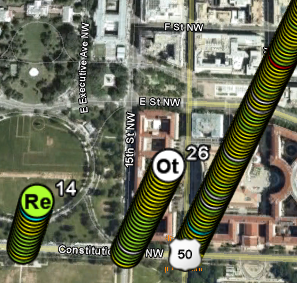
Figure D-3: Displaying collision diagrams and 3-dimensional stacked
symbols for many locations at the same time.
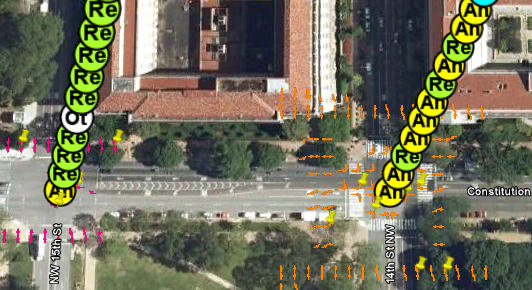
Figure D-4: Same as Figure C-3, except it zooms in closer to the
right two locations, to be able to see the collision diagrams and
individual symbols.
5. In Figures D-3 and D-4, when plotting the 3-dimensional stacked symbols, we choose collisionType from Safety Analyst's sample data as the field to be plotted with symbols. Hence each plotted symbol denotes collision types. For example, symbol "An" denotes angle collision, "Re" denotes rear-end collision, etc. If you are interested in accident severity, you can choose severityType1 as the field to be plotted with symbols, and each stack of symbols would be like Figure C-2. Similarly, you can choose any field in the data to be plotted with symbols. Furthermore, you may choose several fields, each plotted with different stack angle. If you do this, each location will have stacks as shown in Figure C-6. (We created special symbols such as symbol "An", "Re", etc. to be used for Safety Analyst. User can create his/her own to be used for plotting.) When plotting the collision diagrams, user may choose color. We choose orange color for the right-most location, pink color for the second right location, etc. When you click a plotted symbol, either from a collision diagram or a stack, it displays the contents of the original record from Safety Analyst, similar to Figures B-3 or C-5.
6. The above examples show that you can easily plot collision diagrams and crash locations on a map such as Google Earth, even though your data do not have coordinates. If your data already have coordinates (such as from GPS or other means), AIMS-Safety Analyst will use them for displaying.
7. If your data do not have coordinates, we have developed algorithms to enable you to easily display your crash locations on a map, including crashes occurred on local roads, based on research and testing of the datasets that come with Safety Analyst. We have delivered AIMS to over 40 different agencies, each with different data structure, format and coding definition. We are experienced in dealing with crash data and mapping. We were the first commercially to offer GIS accident software. We were the first commercially to plot collision diagrams on a GIS map. We were the first commercially to plot collision diagrams and crash locations in Google Earth. We will be able to display your crash locations on map.
8. Display similar to Figures D-3 and D-4 enable you to visually compare various sites easily. It combines the advantages of collision diagrams and the advantages of 3-dimensional symbols as mentioned in B.10 above. It will help you to make intelligent decisions. It will also help you to present results to others.
back to top
E. It Displays Results In Google Earth
and Google
Maps:
1. The output of AIMS-Safety Analyst can be displayed in Google Earth and Google Maps.
2. It is because AIMS-Safety Analyst can save the output in KMZ format. KMZ (or KML) was adapted by the Open Geospatial Consortium (OGC) in 2008 as a standard for "geographic annotation and visualization on existing or future web-based online and mobile maps (2d) and earth browsers (3d))." (See http://www.opengeospatial.org/standards/kml. KML=Keyhole Markup Language)
3. Figures D-1 and D-2 as shown in Item D above are collision diagrams and 3-dimensional stacked symbols displayed in Google Earth.
4. Figures E-1 and E-2 are generated by AIMS-Safety Analyst from exactly the same data
as Figures D-1 and D-2 but
displayed in Google Maps.
In each figure, when you click a plotted symbol, it will display the
contents of the crash record from the Safety Analyst's data, similar to
Figure B-3 or Figure C-5.
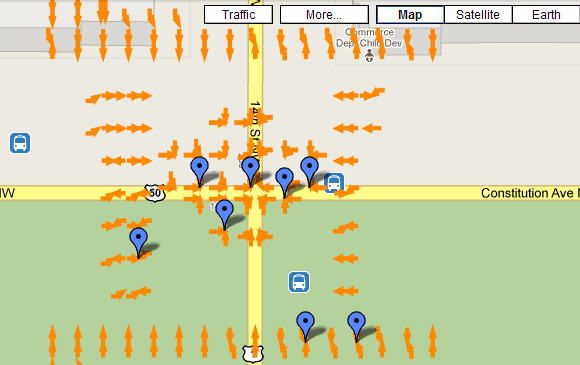
Figure E-1: Collision diagrams for the same data as Figure D-1 but displayed in Google Maps.
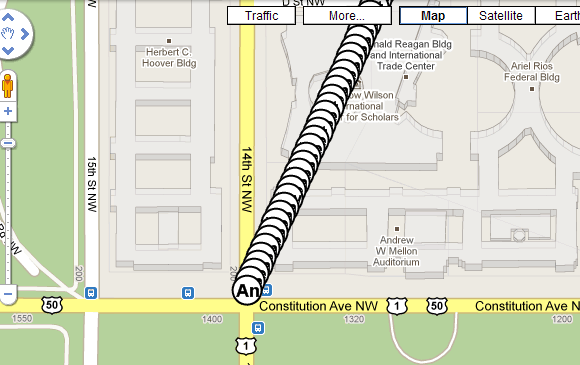
Figure E-2: 3-Dimensional stacked symbols for the same data as Figure
D-2 but displayed in Google Maps
back to top
F. Computer Requirements:
1. A computer with Windows® 7 or 10; any Intel Core or equivalent CPU; 2 GB or more of RAM; 100 GB or more of free hard disk space; 1024x768 color screen.
2. Safety Analyst from AASHTO (AASHTOWare Safety Analyst).
3. Google Earth® 5x or later
to be installed in your computer, if you want to display outputs in
Google Earth. (Free download from
http://earth.google.com
.)
back to top
G. Price:
Please contact us. Email:
jmw@jmwengineering.com
Phone: 703-503-3219.
back to top
H. Demo Video:
In this video, you will see AIMS-Safety Analyst in action and how it interfaces
with Safety Analyst. You will see how it plots collision diagrams and crash locations
(in 3-dimensional stack symbols)
on map. It has voice explanations. It shows you many of
the features described in the previous sections. The video is about 13 minutes.
How to play the video:
1. Click the button below to play the video from YouTube.
2. Or, if you have installed Windows Media Player, click here to play the video.
back to top
Safety AnalystTM is the trademark of the American Association of State Highway and Transportation Officials (AASHTO)
| Home AIMS AIMS-Internet AIMS-SafetyAnalyst About Us Contact |
| Copyright © 2020, JMW Engineering, Inc. All rights reserved. Protected by U.S. Patent 6104410 |